Statics of Number of Trademark Application in Main Countries in Last Five Years
2018/01/12 IP Statistic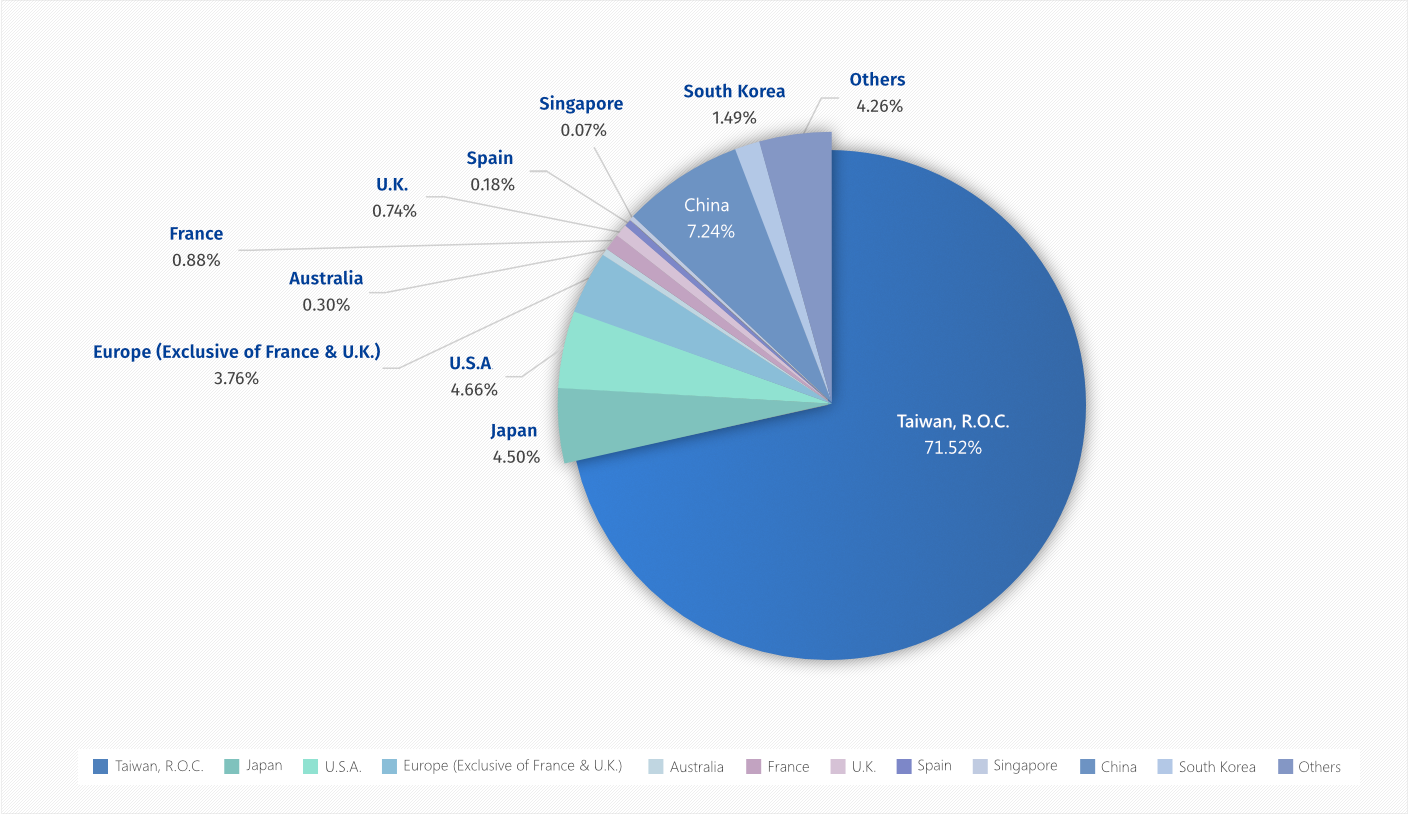
| Year | Taiwan, R.O.C. |
Japan | U.S.A. | Europe (Exclusive of France & U.K.) |
Australia | France | U.K. | Spain | Singapore | China | South Korea |
Others | Total |
|---|---|---|---|---|---|---|---|---|---|---|---|---|---|
102 |
55,338 |
3,593 |
3,694 |
3,175 |
184 |
665 |
633 |
140 |
319 |
2,830 |
737 |
2,863 |
74,171 |
103 |
56,217 |
3,452 |
3,799 |
2,958 |
270 |
804 |
603 |
129 |
306 |
3,263 |
975 |
3,286 |
76,062 |
104 |
57,356 |
3,484 |
3,835 |
3,243 |
228 |
703 |
567 |
160 |
364 |
13,919 |
1,293 |
3,531 |
88,683 |
105 |
57,548 |
3,669 |
3,735 |
2,965 |
248 |
658 |
613 |
185 |
403 |
4,281 |
1,447 |
3,733 |
79,485 |
106 |
61,215 |
3,892 |
3,684 |
2,766 |
263 |
720 |
563 |
117 |
528 |
4,830 |
1,521 |
3,703 |
83,802 |
Total |
287,674 |
18,090 |
18,747 |
15,107 |
1,193 |
3,550 |
2,979 |
731 |
1,920 |
29,123 |
5,973 |
17,116 |
318,401 |
Release Date: January 12, 2018